
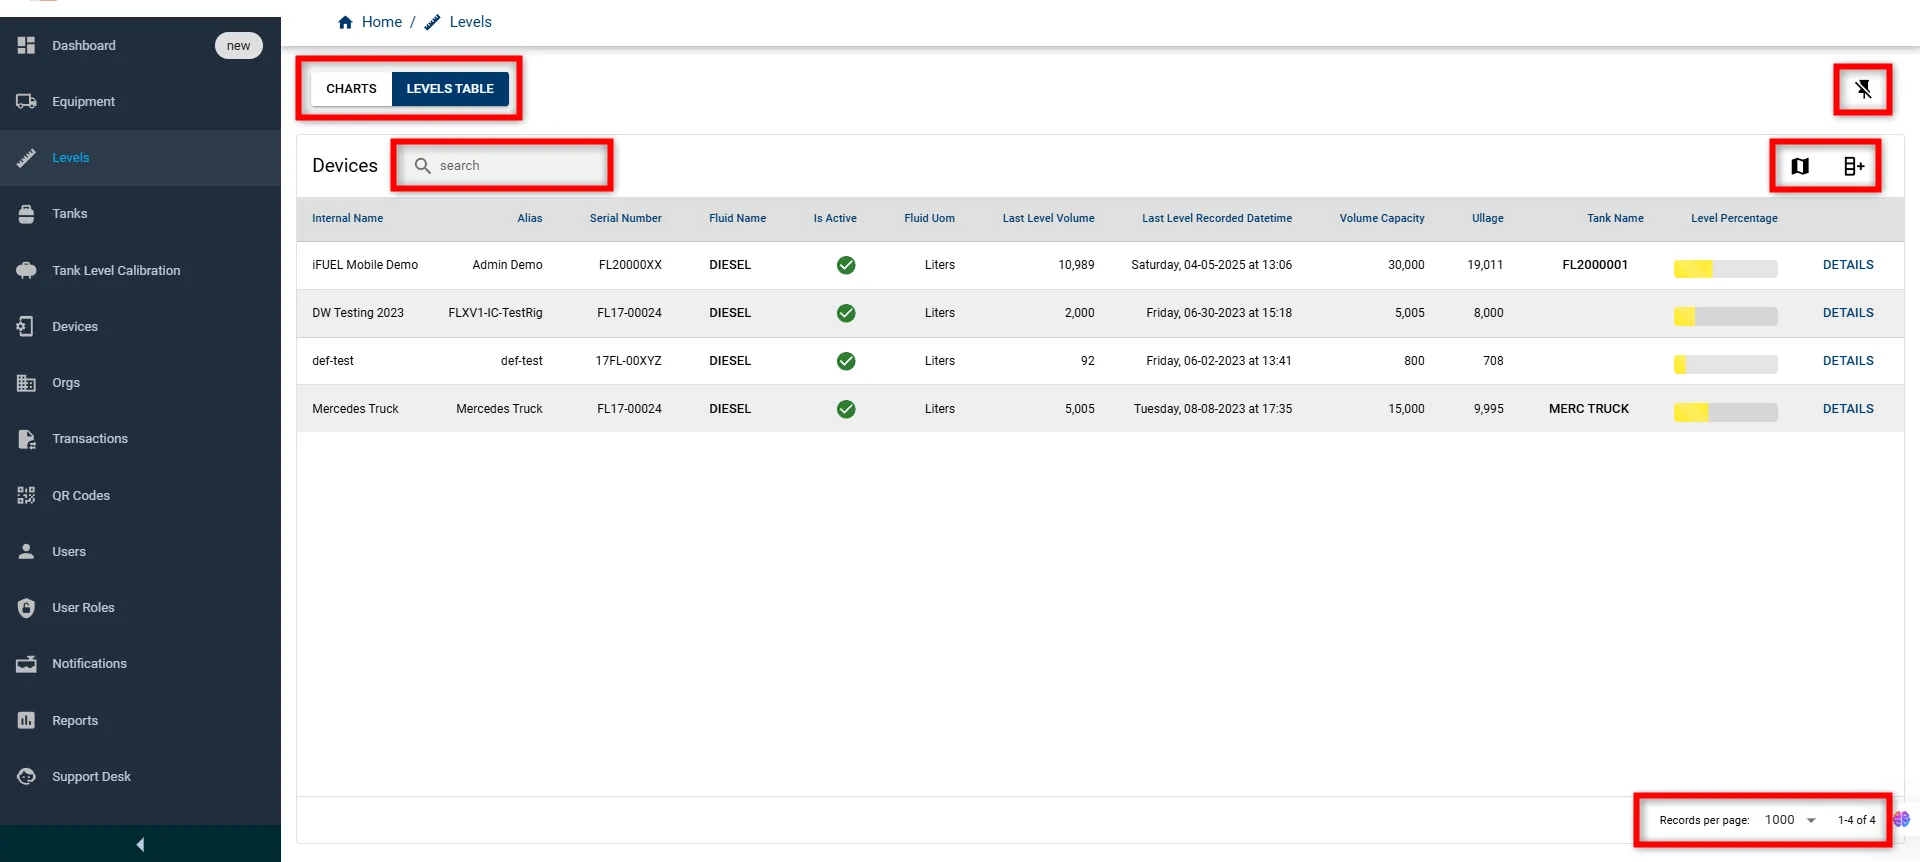
Levels List View
The Levels List View in Fuellox offers a structured interface for monitoring tank levels across various devices. This view allows users to track real-time fluid volumes, view historical level data, and assess capacity utilization at a glance.
The Levels module provides two tabbed interfaces for managing data insights:
-
Levels Table View – Displays device-level data in a structured tabular format.
-
Charts View – Visualizes tank level trends over time.
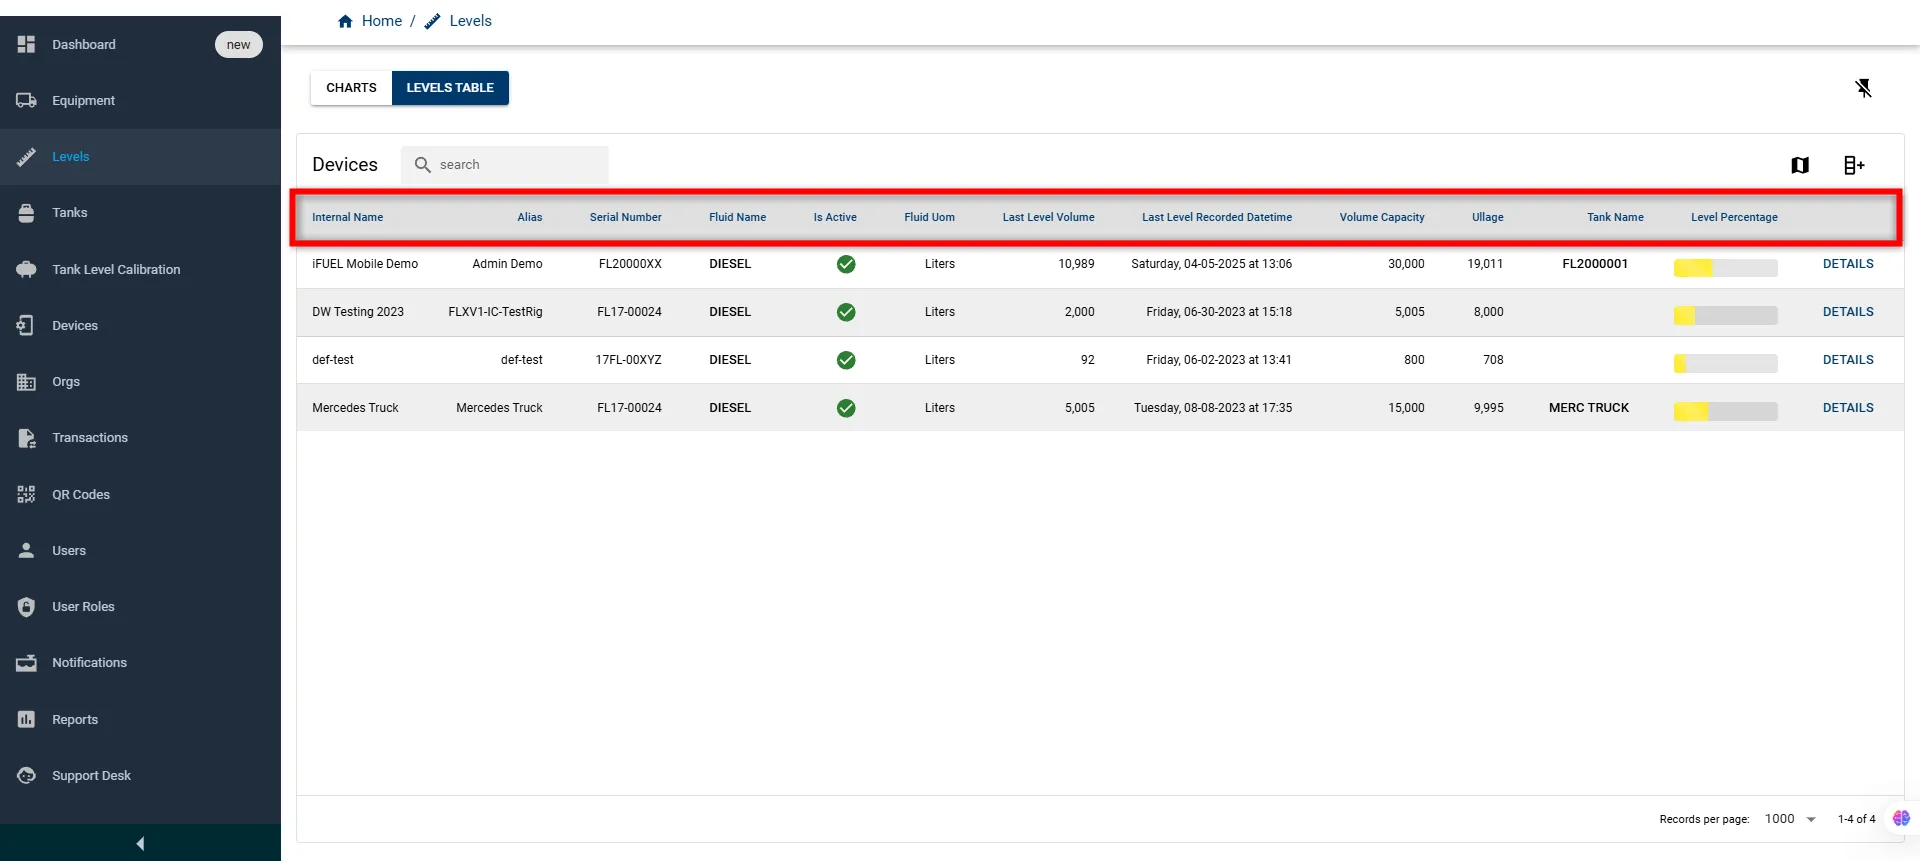
Levels Table View
Displays detailed tank data in a tabular format, allowing users to monitor volume, ullage, tank status, and device-specific metrics at a glance.
Levels UI Features
The following are the available UI features in the Levels List View in Fuellox, enabling users to monitor and manage tank level readings with ease:
| Feature | Description |
|---|---|
| Tabs (Charts / Levels Table) | Switch between a visual graph-based view (Charts) and a tabular view (Levels Table). |
| Search Bar | Allows users to filter device entries by keywords like internal name or alias. |
| Toggle Floating (Pin Icon) | Enables the user to pin or float the levels table for persistent visibility. |
| Show Map / Filter Columns | Toggles display settings to show location maps or enable/disable column filters. |
| Records Per Page | Lets the user define how many device entries are visible per page. |
Levels List
Below is a quick reference to the fields available in the Levels View with their descriptions.
| Field Name | Description |
|---|---|
| Internal Name | The unique internal identifier for the device. |
| Alias | User-friendly display name or nickname for the device. |
| Serial Number | The device’s serial number, used for hardware identification. |
| Fluid Name | Type of fluid monitored (e.g., Diesel). |
| Is Active | Indicates whether the device is currently active (✓ = active). |
| Fluid UOM | Unit of measure for the fluid (e.g., Liters). |
| Last Level Volume | Most recent fluid volume recorded by the device. |
| Last Level Recorded Datetime | Date and time of the last level reading. |
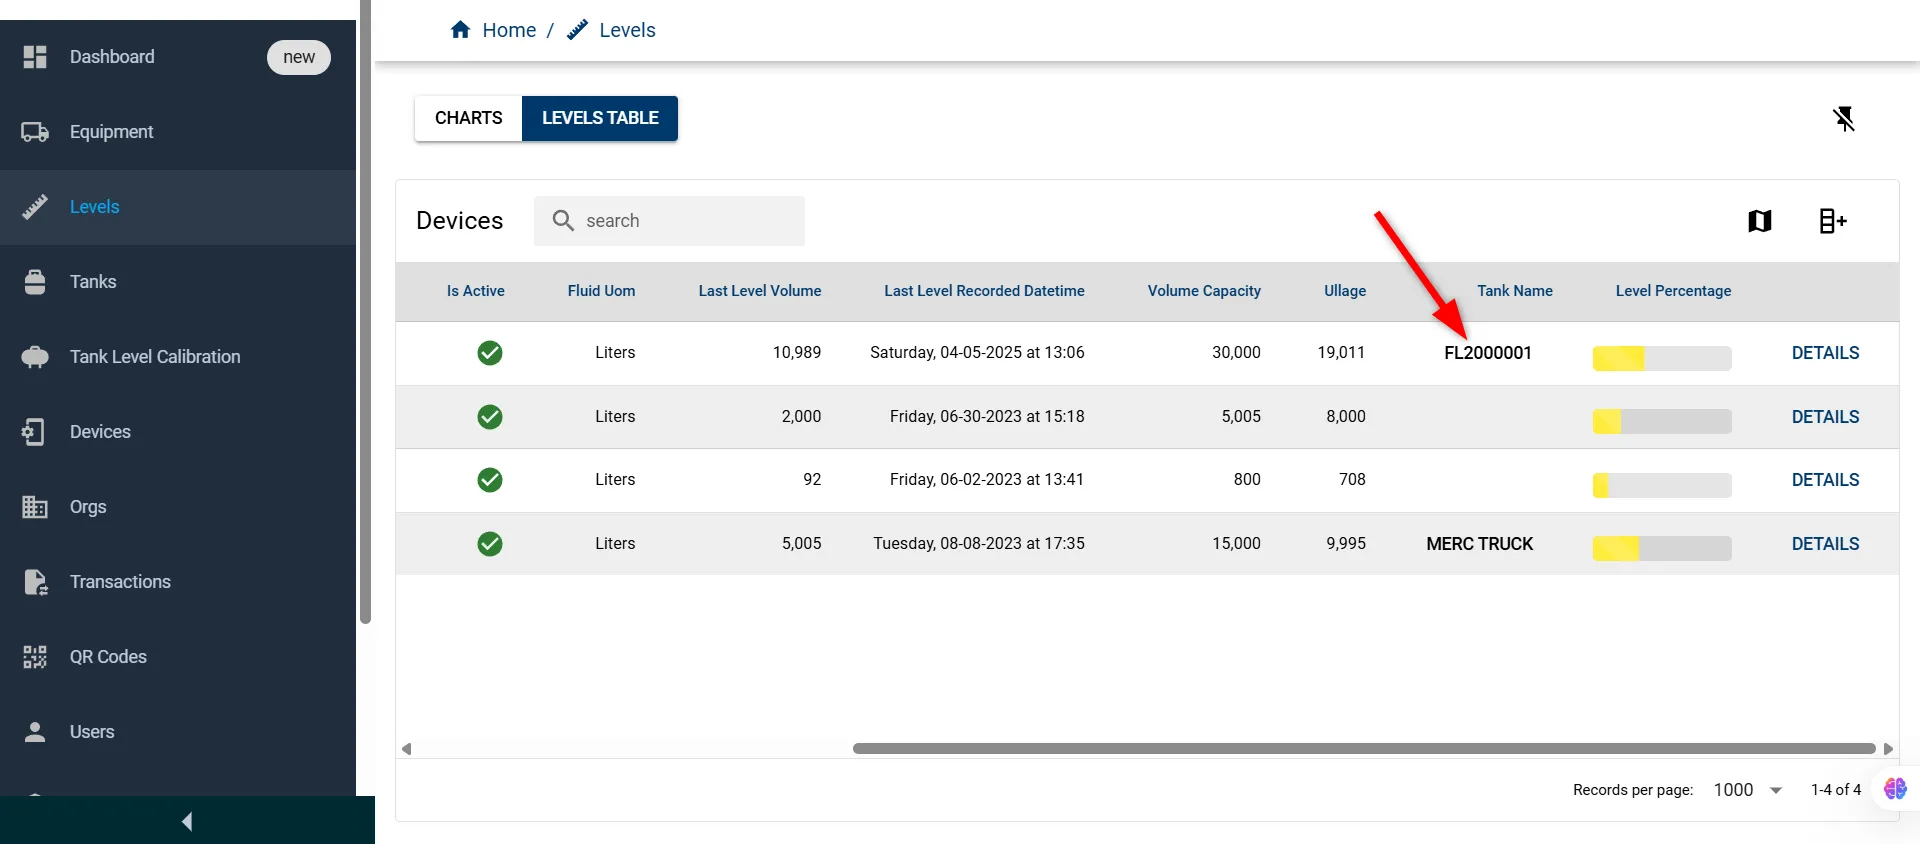
| Volume Capacity | Total capacity of the tank or device. |
| Ullage | Empty portion of the tank (Capacity - Volume). |
| Tank Name | Name of the tank associated with the device. |
| Level Percentage | Visual representation of the filled level as a percentage bar. |
| Details | Link to view more detailed level data for the selected device. |
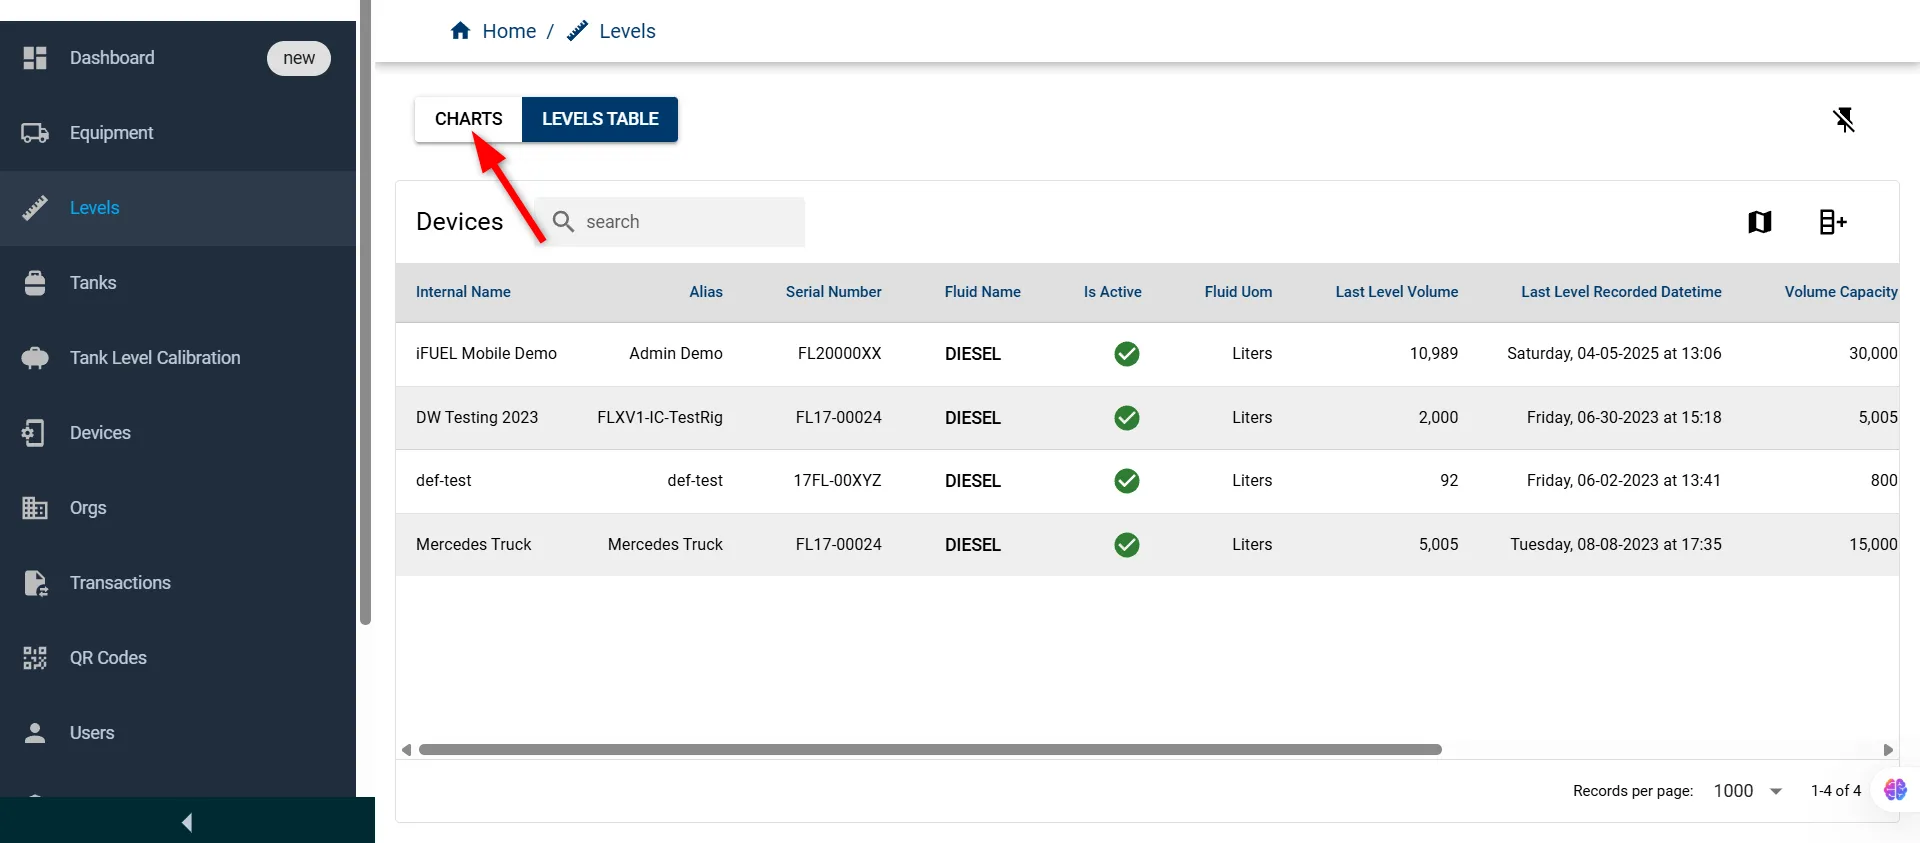
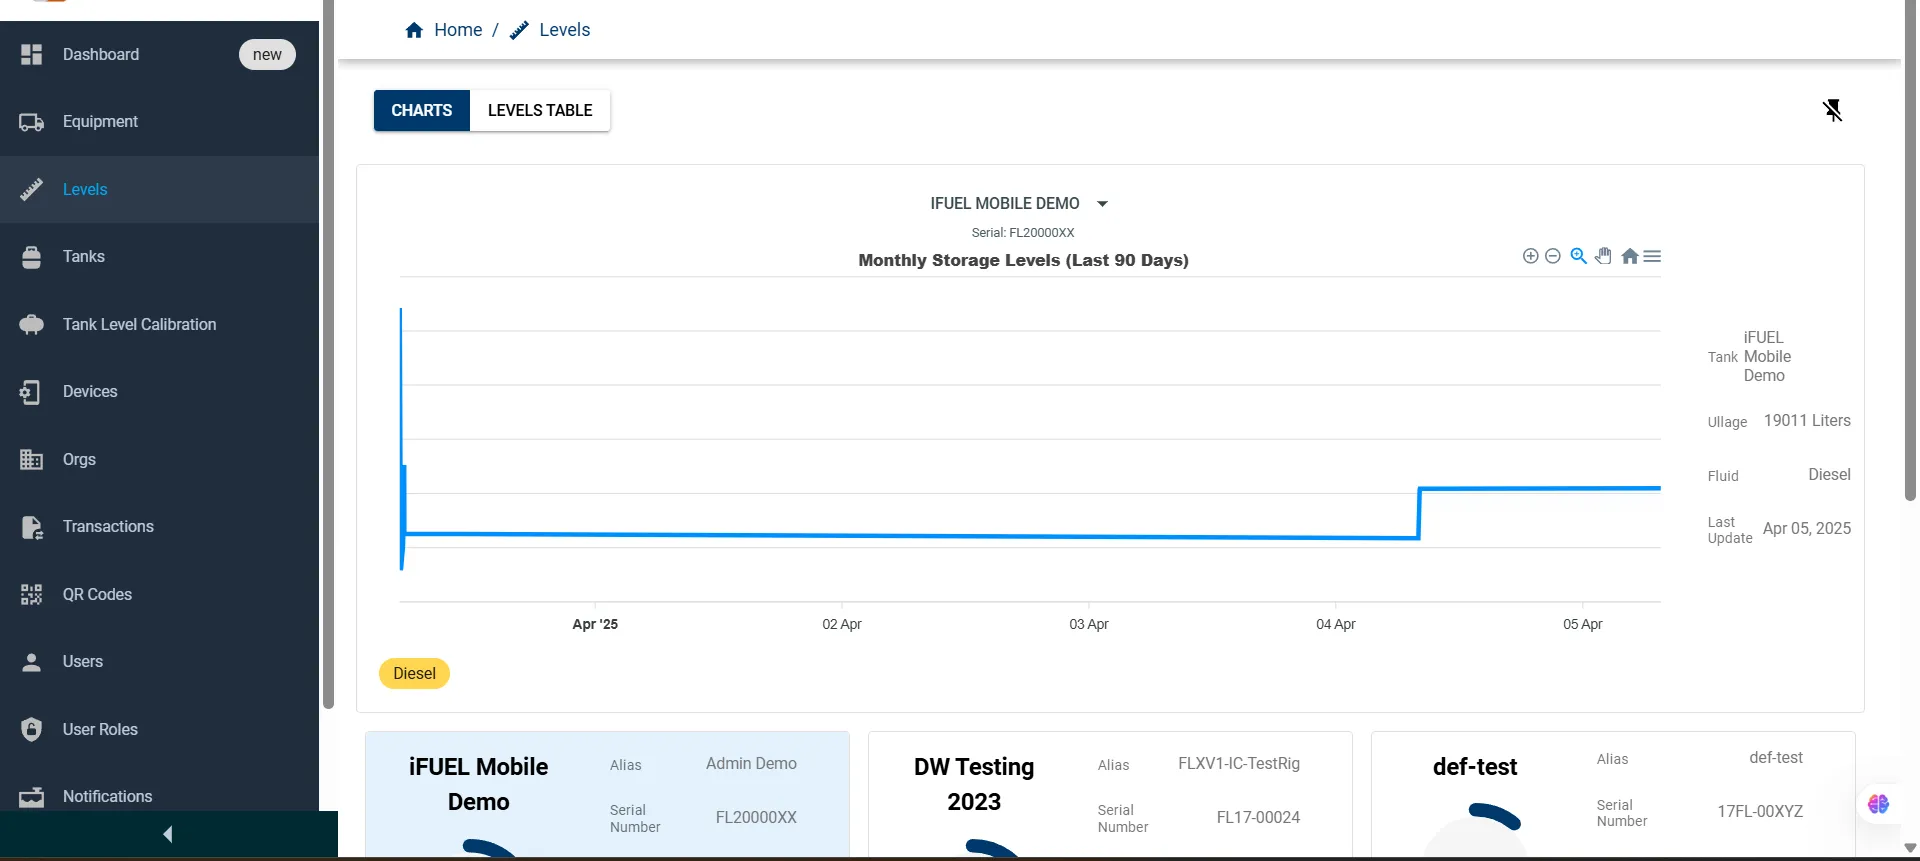
How to View Charts
Click on the CHARTS tab at the top of the Levels section to switch from the detailed Levels Table to a visual graph-based overview of tank levels.
The Charts page will open, presenting a visual overview of monthly storage levels and tank statistics for the selected device.
Once inside the Charts View under the Levels section, the screen is divided into two primary sections:
-
Graph Area
-
Tank Summary Cards
Each section offers a unique perspective to help users monitor, compare, and analyze fluid levels across different tanks.
Let’s explore these sections in detail below.
Graph Area
This Graph provides a visual graph representing fuel storage levels recorded over the past 90 days for selected devices. It helps users monitor tank behavior and trends across time.
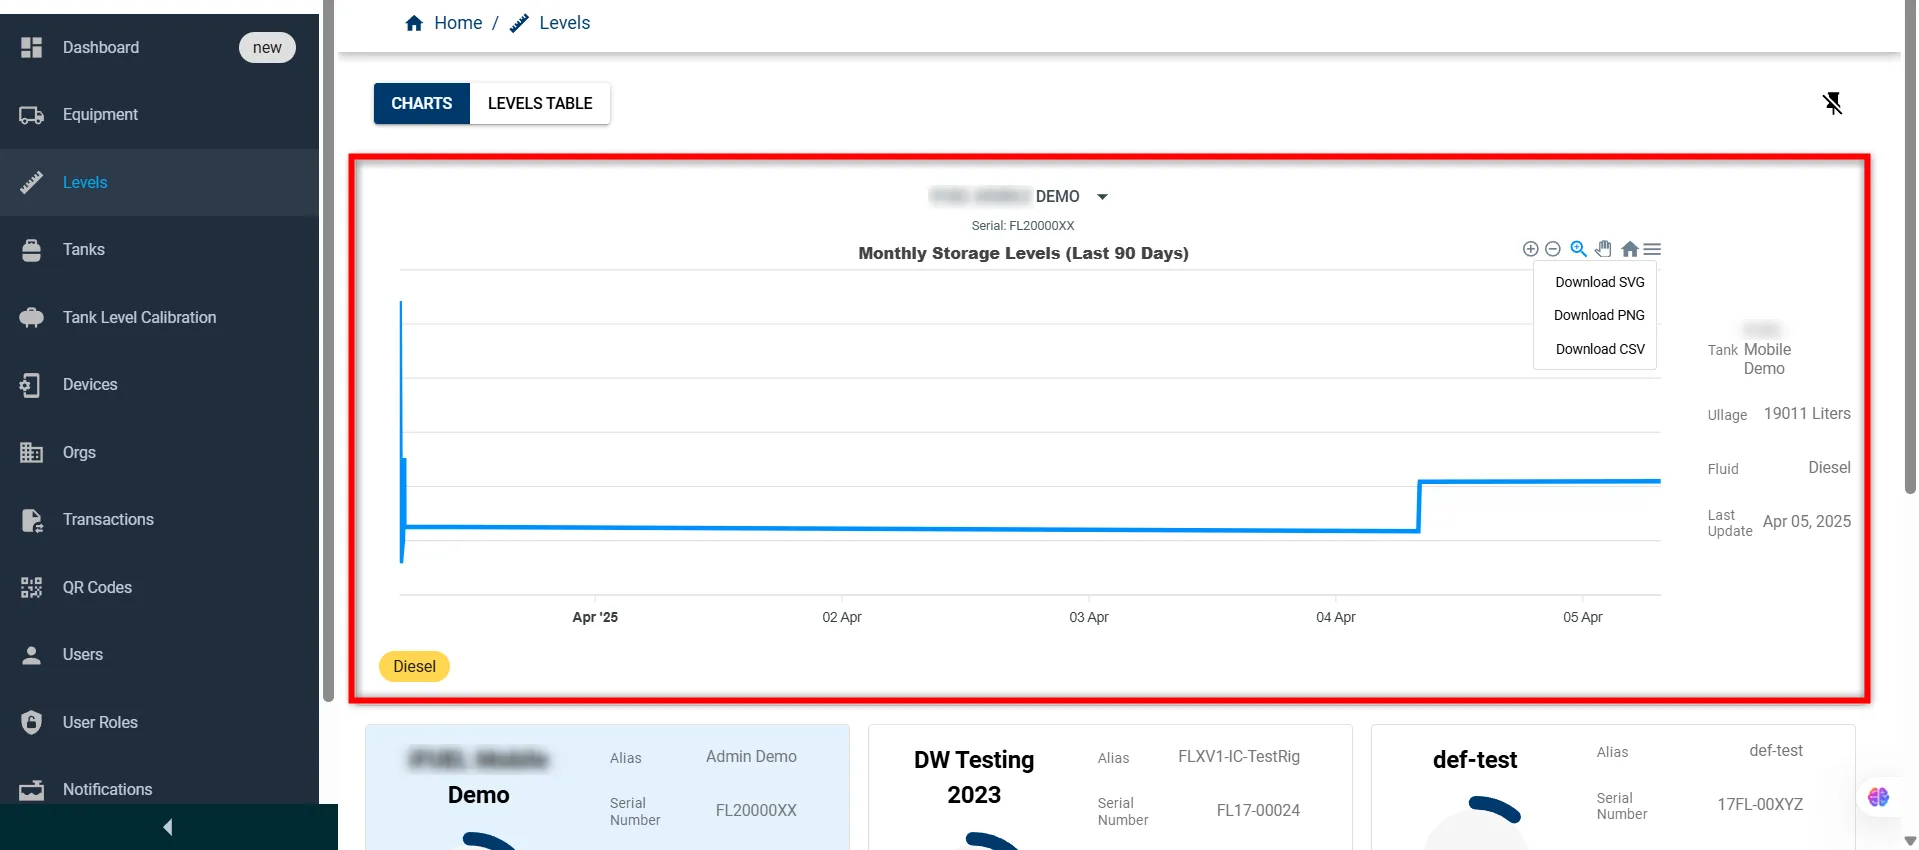
It has the following features and tools:
| Feature | Description |
|---|---|
| Device Selector | A dropdown menu to choose which device’s data to display. You can filter by Alias, Internal Name, or both. |
| Zoom In | Focus on a specific part of the graph for closer analysis. |
| Zoom Out | Return to a broader view of the entire 90-day range. |
| Magnify | Highlight smaller details within the curve. |
| Pan Tool | Navigate horizontally across the timeline. |
| Reset View | Revert to the default full-graph view. |
| Toggle Legend/Series | Show or hide the data legend and graph series. |
| Export Chart | Download the graph as SVG, PNG, or CSV format. |
Tank Summary Cards
Each of the following summary cards presents a compact view of individual tank performance and characteristics:
-
Selected Tank Card Presents a highlighted overview of the selected tank, showing current fill percentage, fluid type, and volume. It also includes key metadata like the alias, serial number, ullage, total capacity, and the last updated timestamp.
-
DW Testing 2023 Offers a quick view of a testing unit’s fuel status. The card includes fluid volume details, identification data (like alias and serial number), as well as capacity-related metrics and update time.
-
def-test Displays a low-volume tank typically used for test or calibration purposes. It summarizes the fill percentage, fluid type, and important identifiers like serial number and alias for reference.
-
Mercedes Truck Reflects a mobile tank installation, often associated with a specific vehicle. The card provides real-time metrics including ullage, total capacity, and current fluid levels, along with the tank identity and update log.
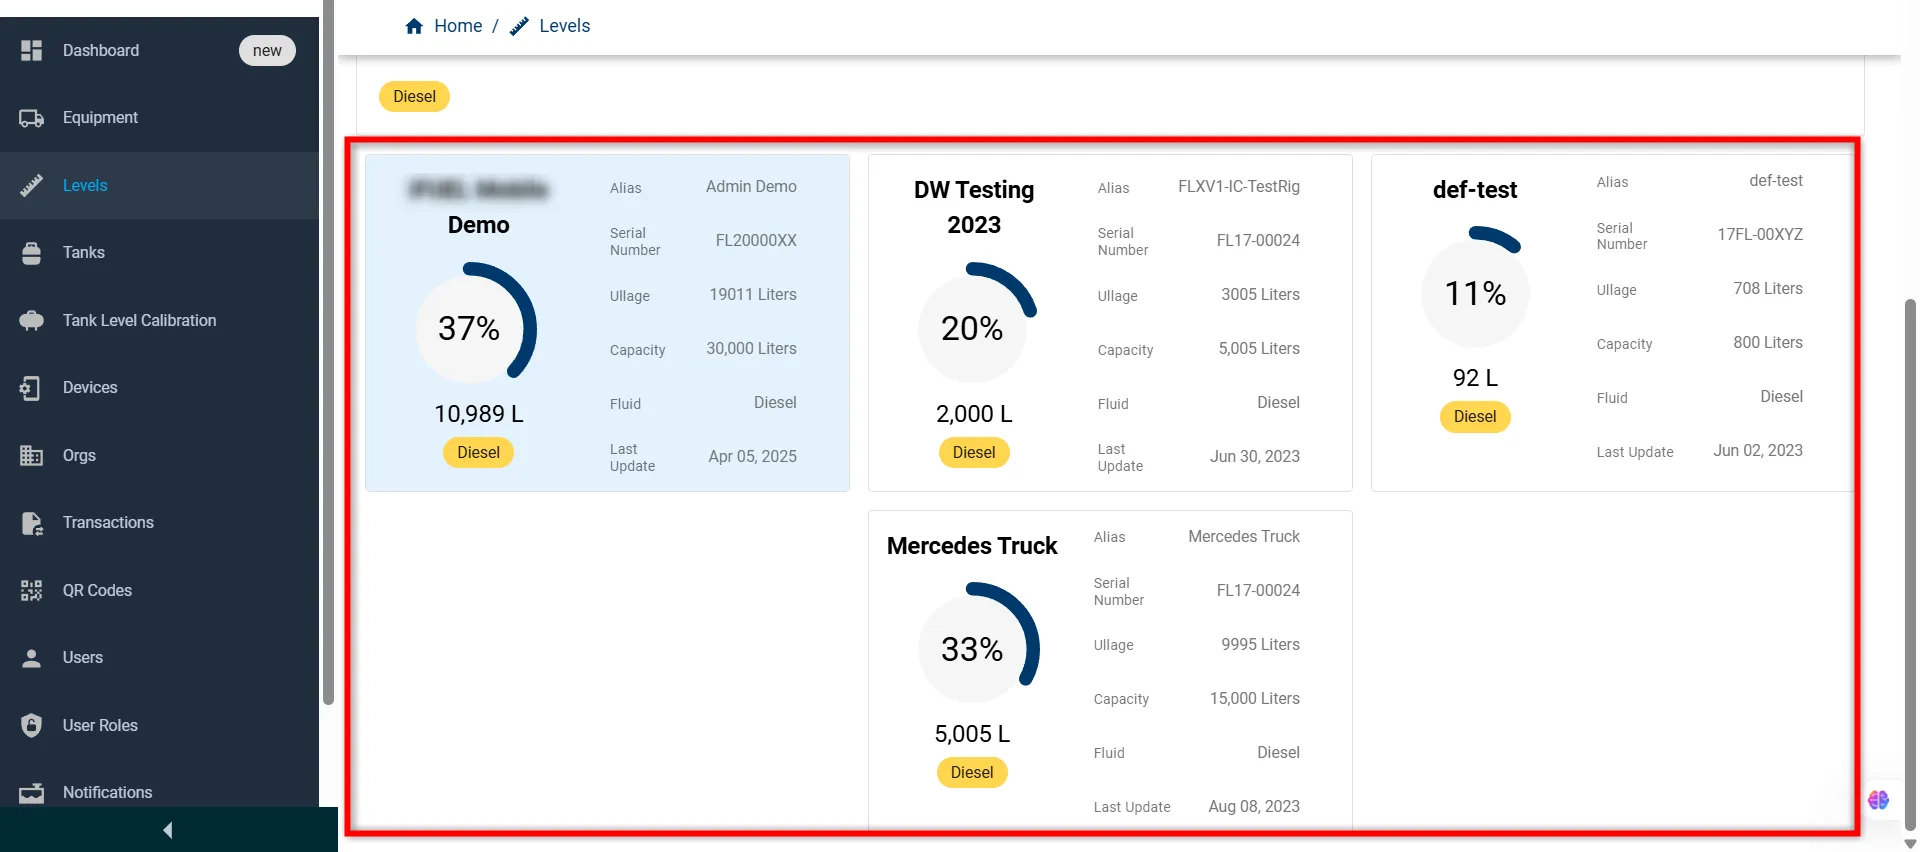
These summary cards not only give quick insights into each tank’s status but are also interactively linked with the chart above.
When a user clicks on any of the cards, the graph updates to display that tank’s historical storage levels, enabling an immediate visual correlation between summary data and performance trends.
For more information on the simplified Transaction option, please contact the Fuellox Help Desk.
Return to Getting Started