
View the Reports
The Reports section in Fuellox provides a comprehensive suite of data tables and visualizations that help you track fuel usage across users, devices, tanks, and projects. With various filtering and summary options, these reports simplify tax handling, cost analysis, and emissions tracking.
How to View the Reports
-
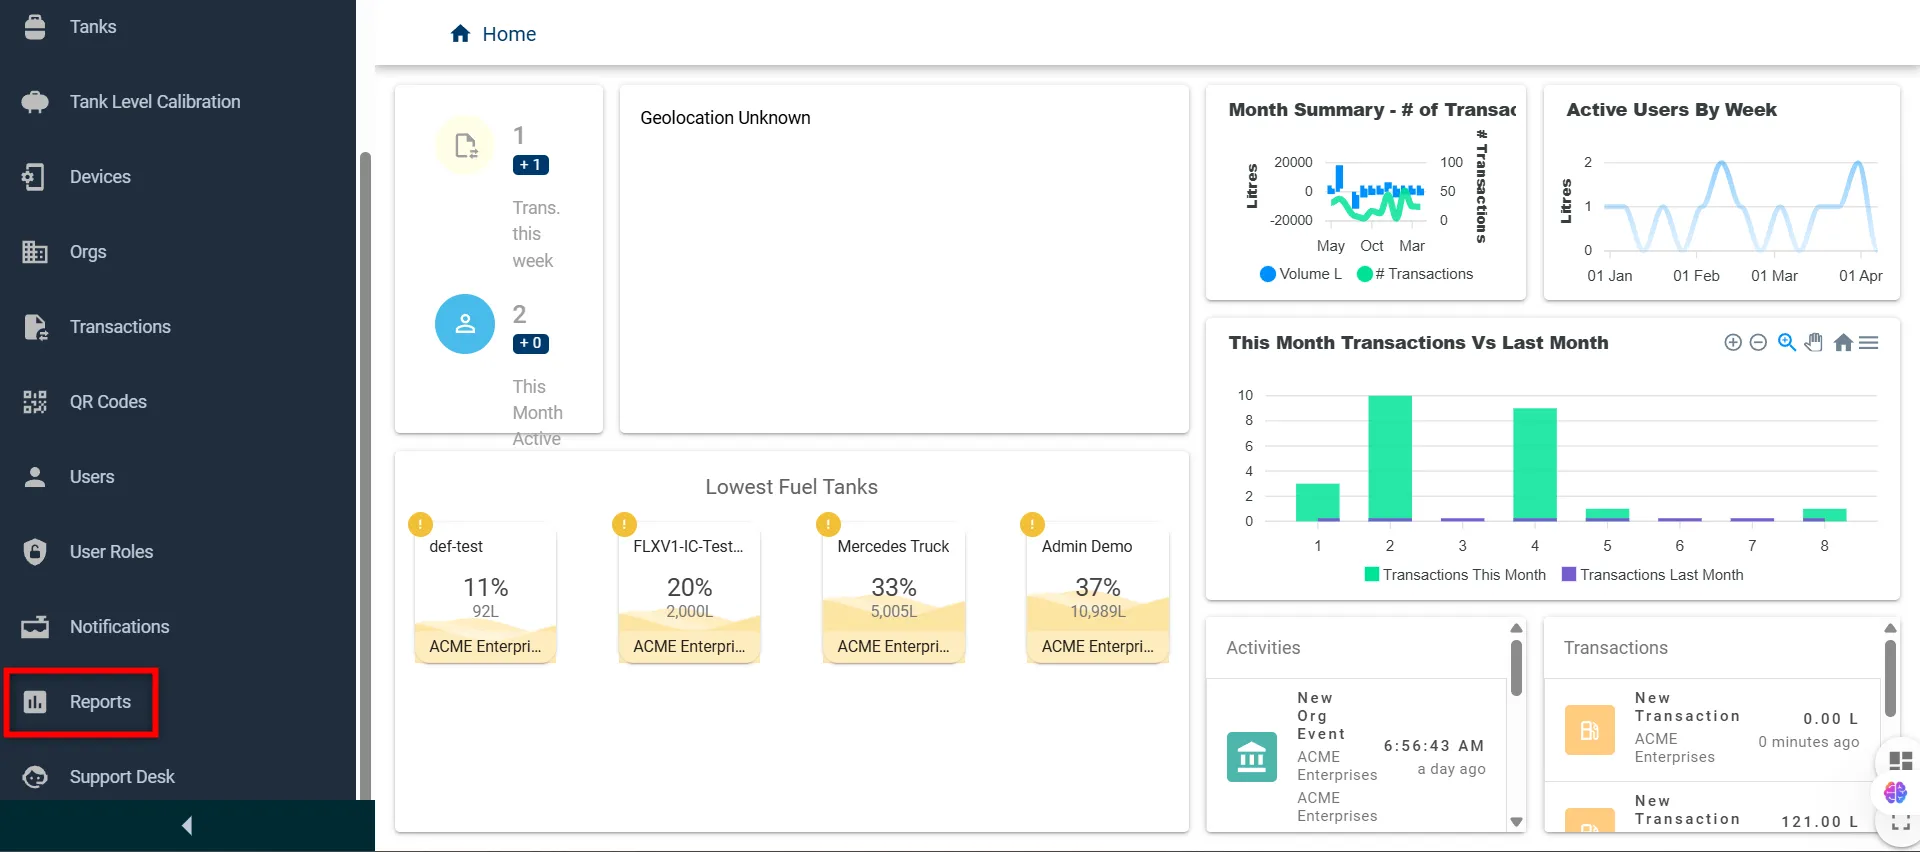
Log in to the Fuellox platform at app.fuellox.io and navigate to the Reports section From the sidebar.
-
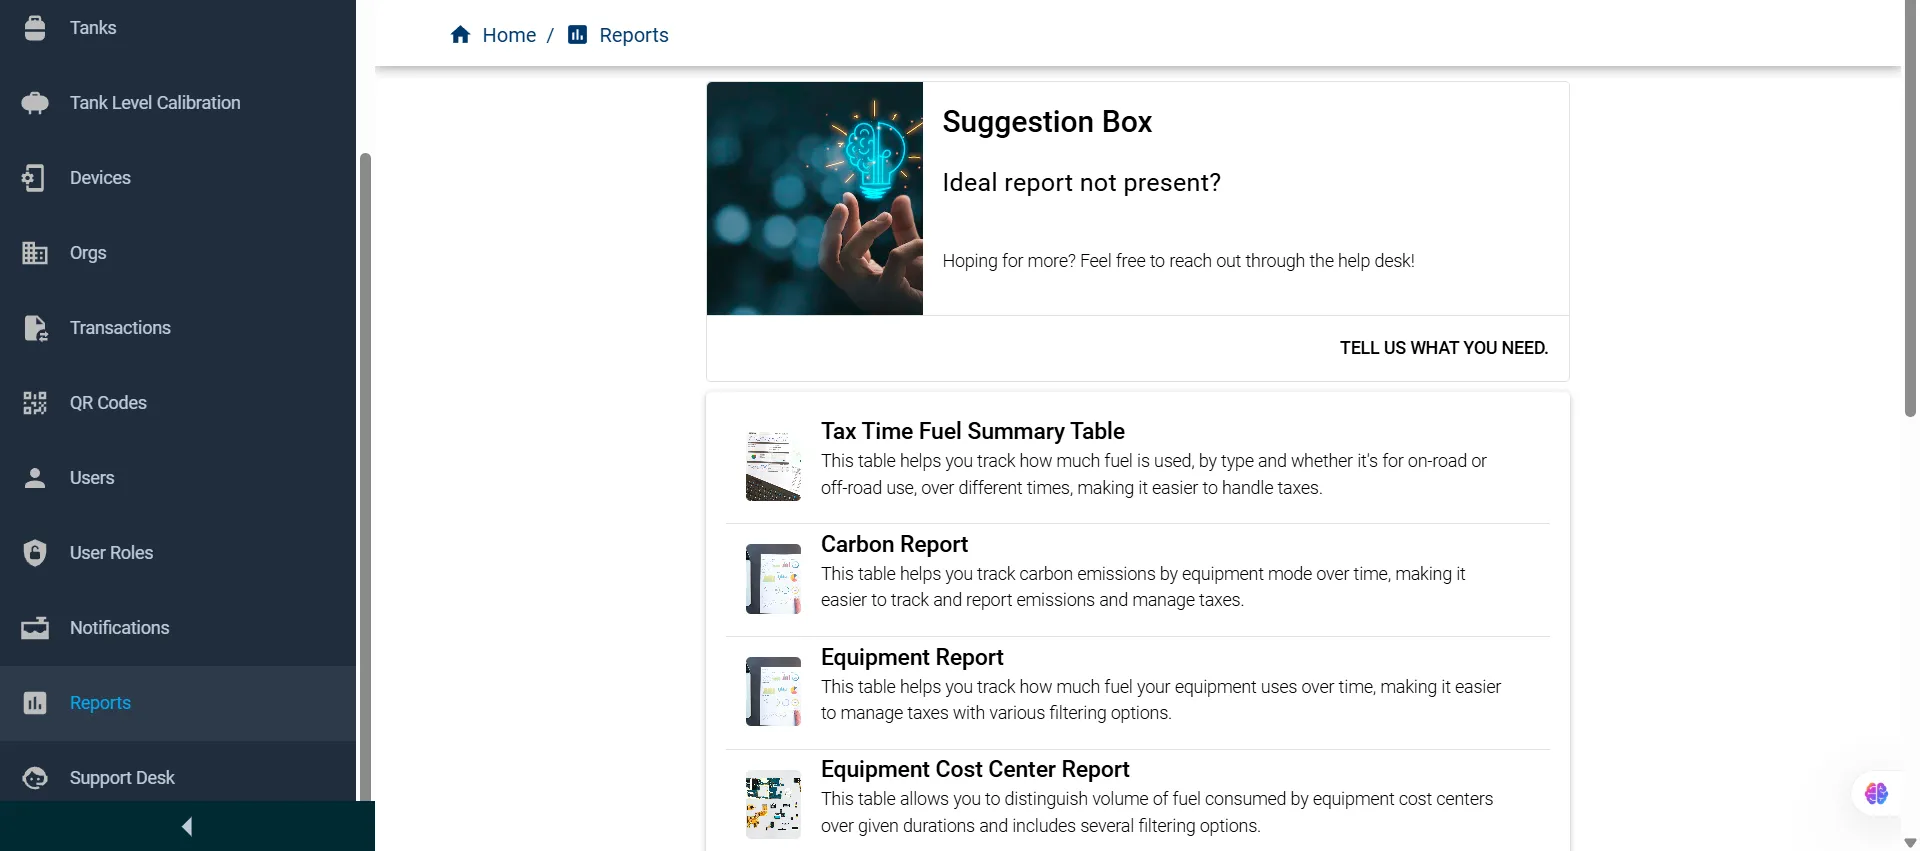
The Reports page will open, displaying a list of available report types for review and analysis.
-
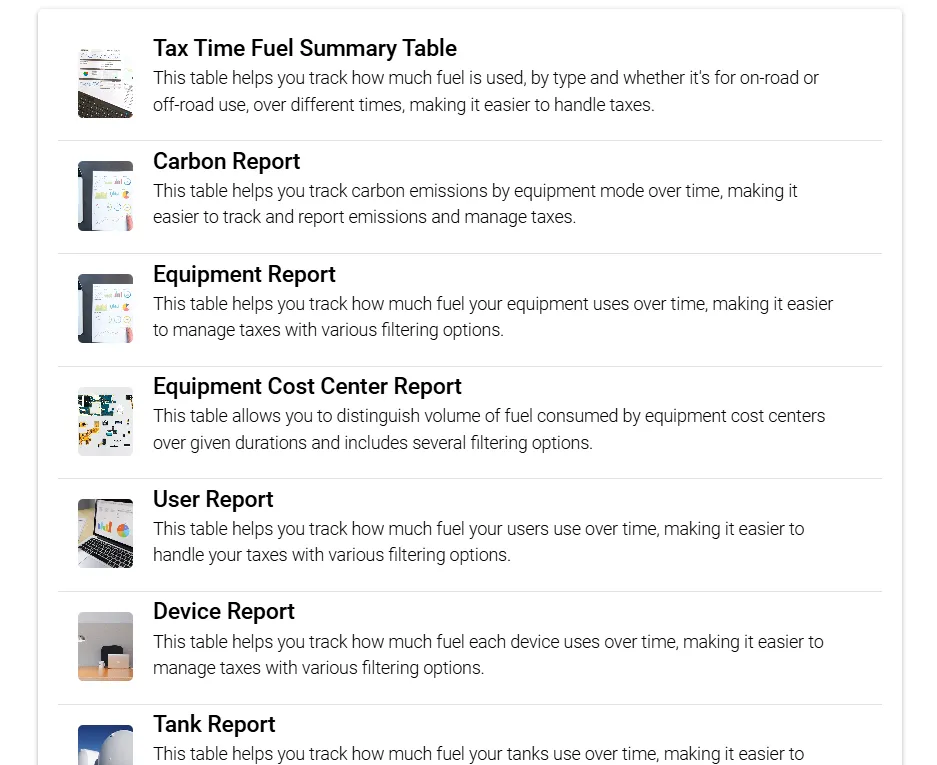
Once you’re on the Reports page, you can explore a wide range of predefined reports tailored to track fuel usage, costs, emissions, and more. Each report offers filtering options to help you analyze data based on your specific needs.
-
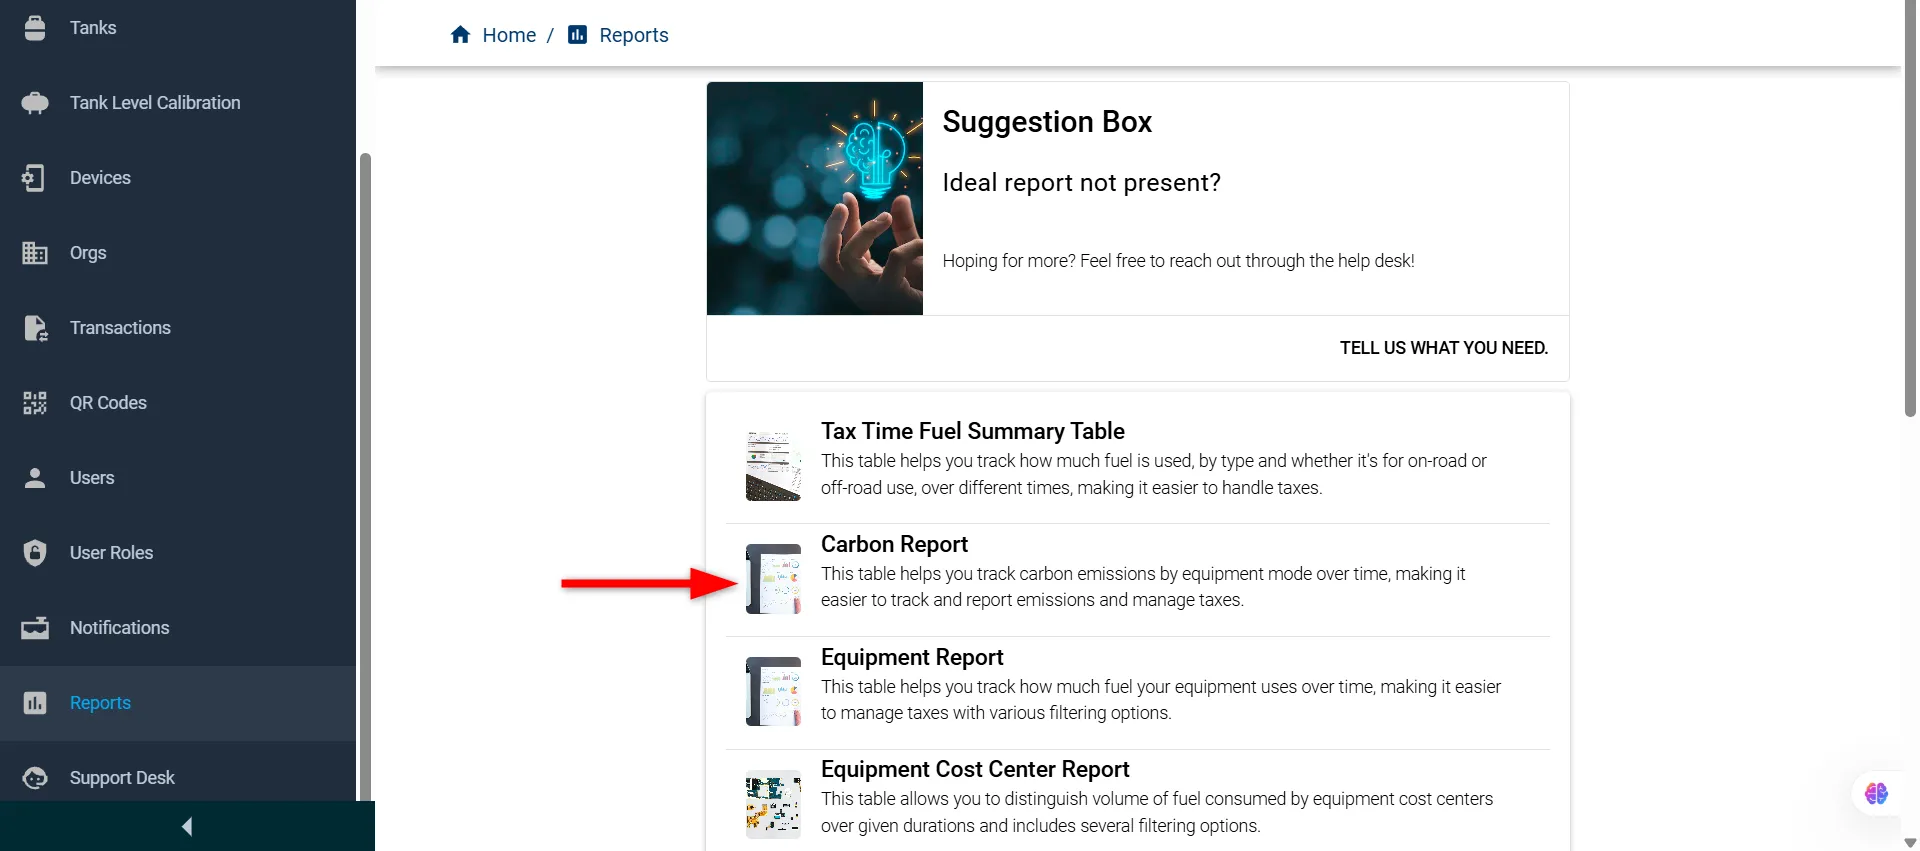
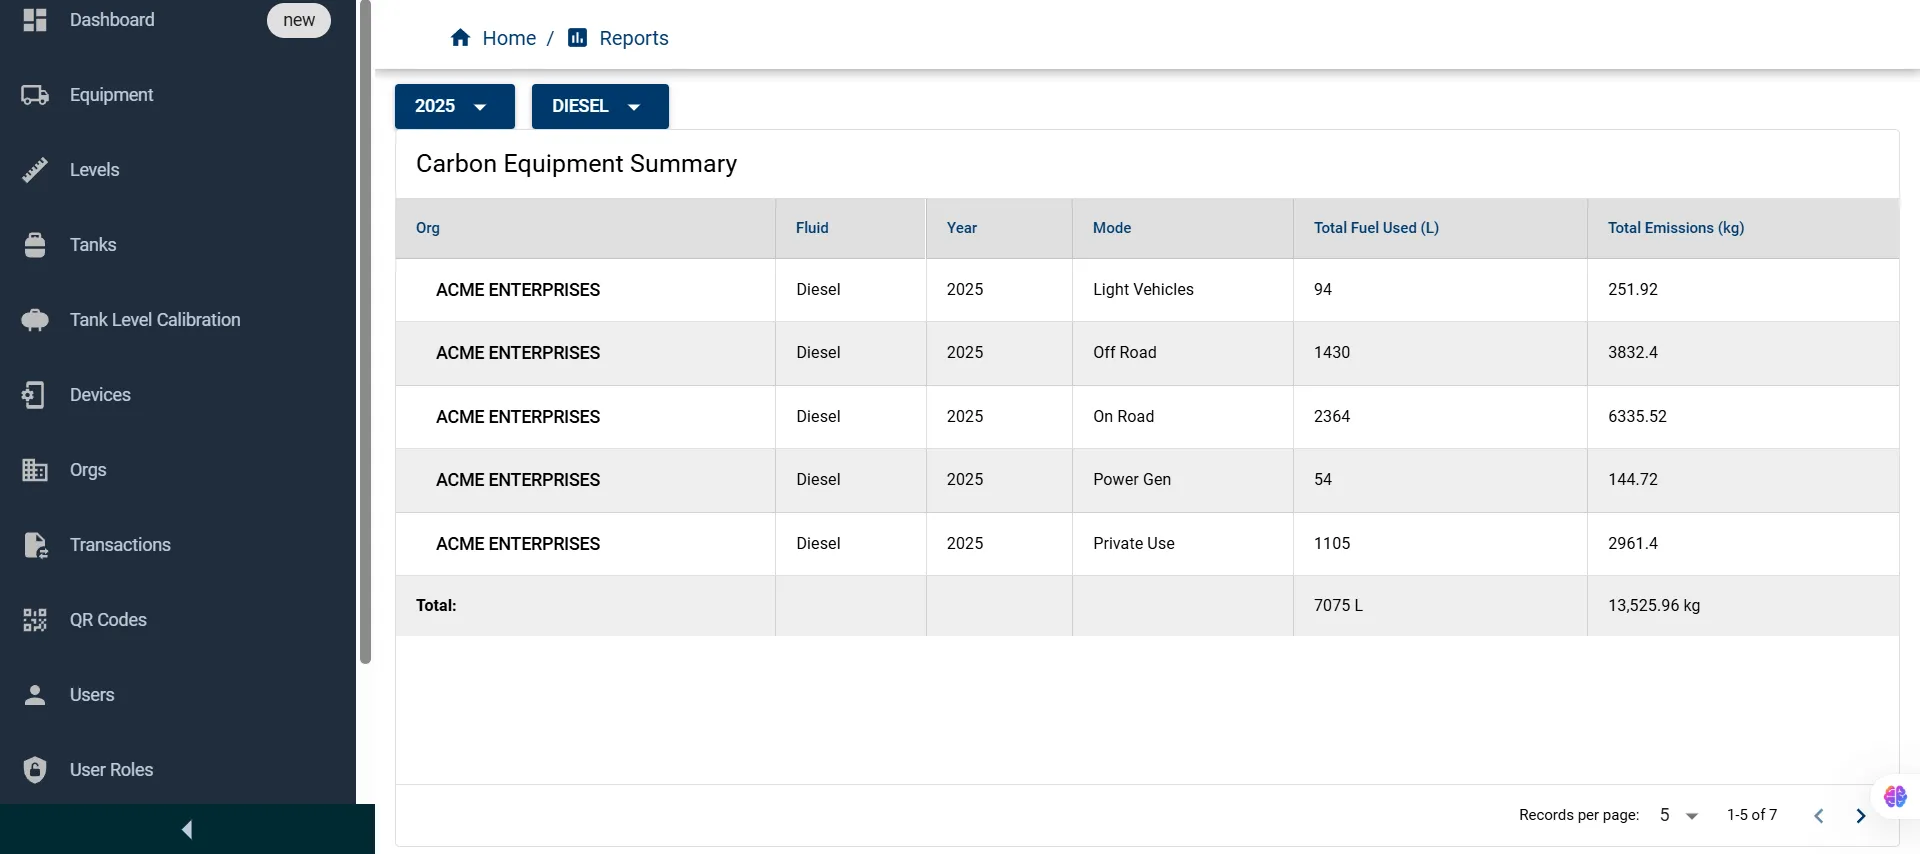
To view a report, click on the report name (such as Carbon report).
-
This will open the report in a new tab, allowing you to analyze the data in detail.
Request a Custom Report
If the available reports don’t meet your requirements, simply click the “Tell Us What You Need” button at the top of the Reports page.
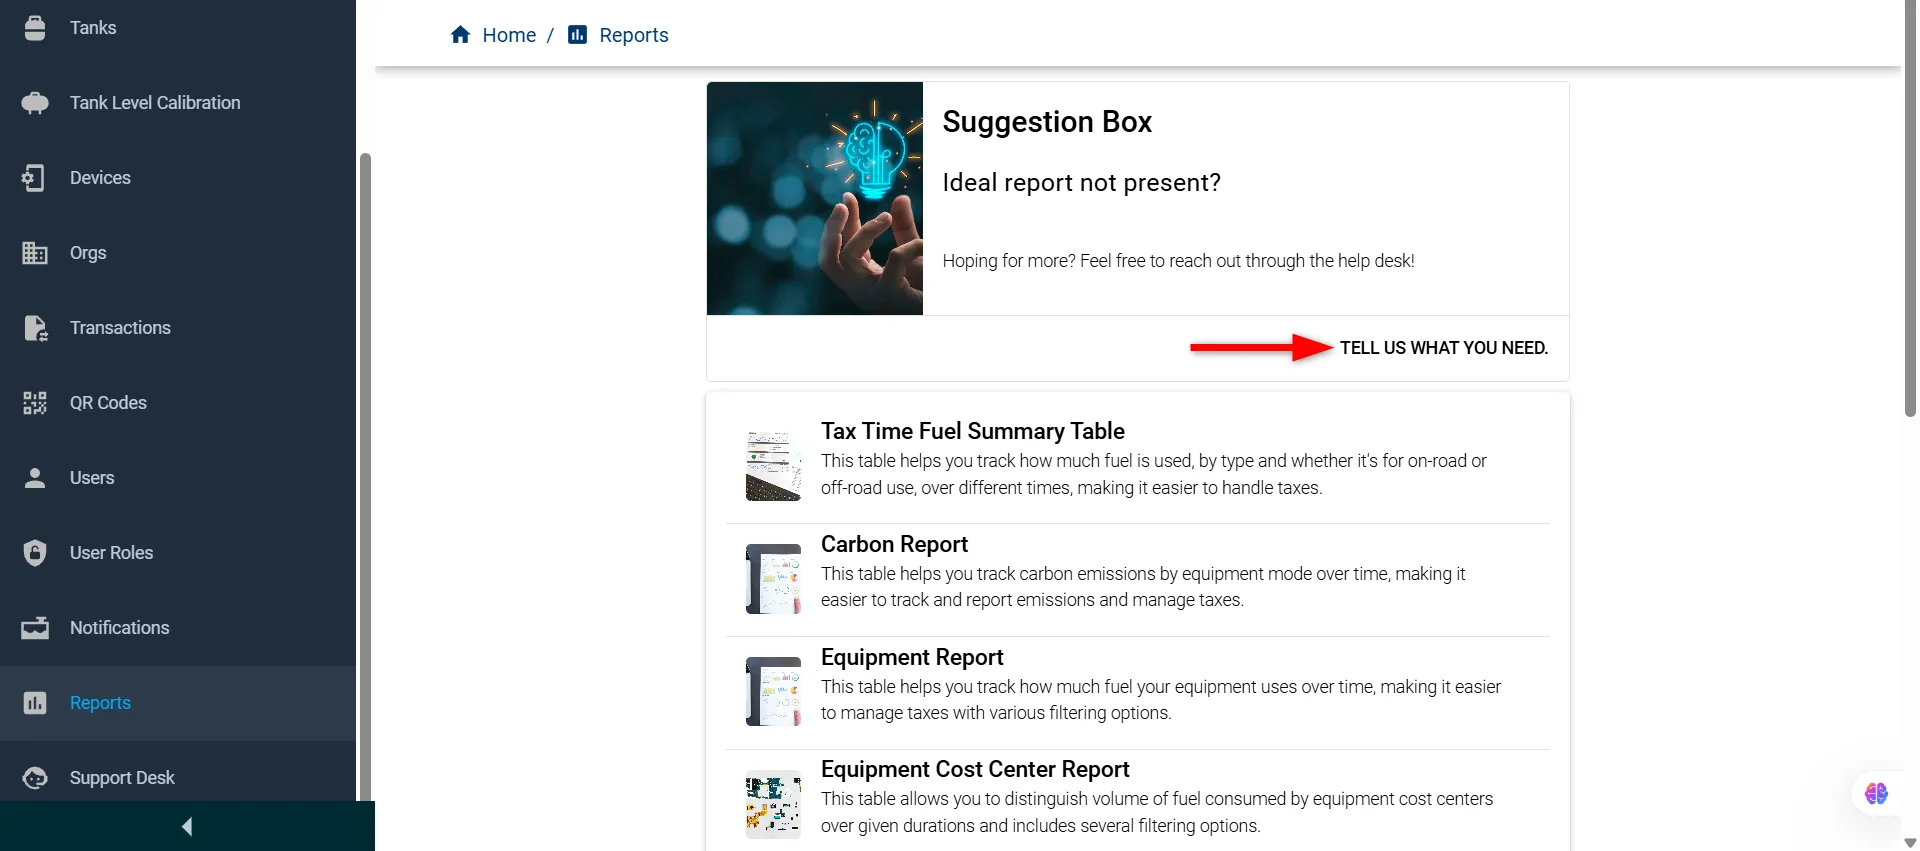
This will open a submission form where you can suggest a custom report. Provide your details and describe your needs—our team will review and work with you to support additional reporting options tailored to your use case.
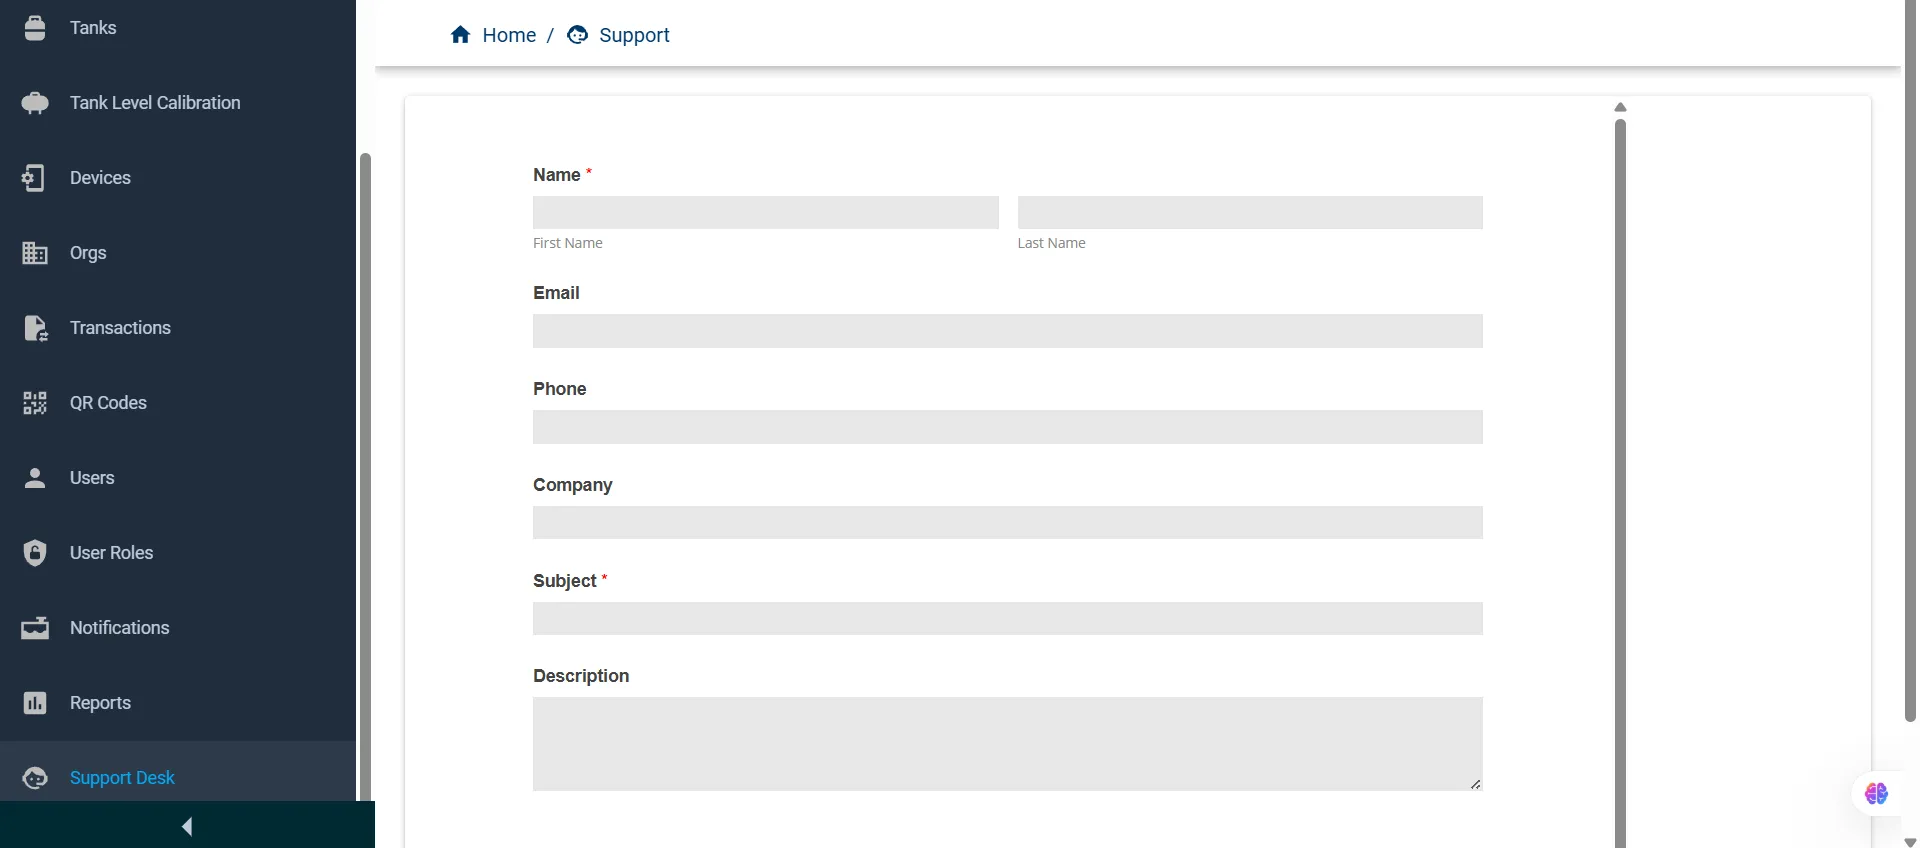
For more information on the Reports option, please contact the Fuellox Help Desk.
Return to Getting Started